




A simple guide to mapping how a stranger becomes a customer, so nothing depends on memory.
Ask three people in a small business what happens after an enquiry arrives, and you will usually get three different answers. That is the problem a flow chart solves.
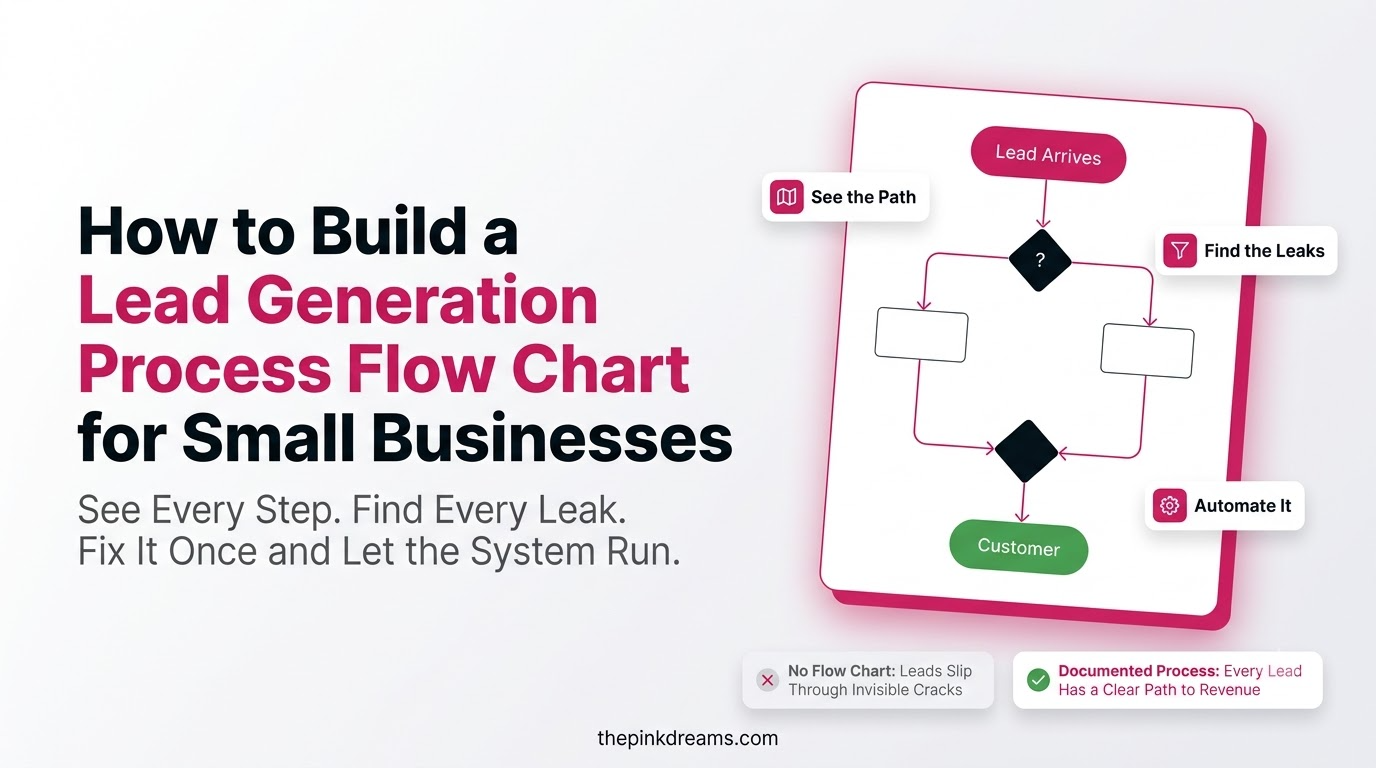
A lead generation process flow chart is a simple diagram showing every step a prospect takes from first contact to paying customer, including the decisions made along the way. It turns a process that lives in your head into something you can hand to a new team member, spot gaps in, and improve deliberately. If you have already read our guide on how to generate leads for small businesses, this article shows how to map what you are doing into one clear picture.
Below you will find the seven stages every chart contains, a simple flow chart you can copy, the decision points that make it genuinely useful, and how to draw it without buying software.
The short answer: map your real process in seven stages, attract, capture, record, qualify, nurture, convert and review, then add decision points and name an owner for every step. Test it against a real enquiry before you finalize it.
Key Takeaways
- A lead generation process flow chart shows every step and decision between first contact and a paying customer.
- Map the process you actually follow first, not the process you wish you followed.
- Decision points are what separate a useful chart from a pretty diagram of boxes.
- Every box needs an owner and a time limit, or steps quietly get skipped when work gets busy.
- Most small business charts fit on one page. If yours does not, it is probably too detailed.
- The chart makes bottlenecks visible, which is why it doubles as a diagnostic tool.
- Use it to train new staff, so your process no longer depends on one person remembering it.
- Review the chart quarterly, because processes drift faster than anyone expects.
What Is a Lead Generation Process Flow Chart?
A lead generation process flow chart is a visual map of your lead generation workflow, showing each step from attracting a prospect to winning or losing the sale. Boxes represent actions, diamonds represent decisions, and arrows show the path a lead takes through your business.
You only need four shapes to draw one:
• Oval: the start and end points, such as “prospect discovers your business” and “customer won”.
• Rectangle: an action someone performs, such as “send quote” or “log enquiry in CRM”.
• Diamond: a decision with two or more answers, such as “is this lead qualified?”
• Arrow: the direction of travel between steps, including loops back to earlier stages.
This is different from a sales funnel diagram. A funnel shows volumes narrowing at each stage, while a flow chart shows the actual sequence of actions and who performs them.
Key Takeaway: A funnel shows what happens to numbers. A flow chart shows what people do.
Why Every Small Business Needs a Documented Lead Generation Workflow
A documented workflow prevents enquiries from being forgotten, makes training faster, and shows exactly where leads are lost. In a small business where one person often handles marketing, sales and delivery, the chart is what stops the process collapsing whenever that person is busy, ill or on holiday.
• Nothing gets dropped: every enquiry follows the same path regardless of who is available.
• Faster training: a new team member can see the whole process in one page rather than learning it by accident.
• Visible bottlenecks: when leads stall, the chart shows which box they are stuck in.
• Consistent customer experience: every prospect receives the same speed and quality of response.
• Easier automation: you cannot automate a process you have never written down.
• Better decisions: the chart makes it obvious which steps add value and which just add delay.
Key Takeaway: A process that only exists in someone’s head is a process that stops when they do.
The 7 Stages of a Lead Generation Process Flow Chart
Almost every small business lead generation workflow contains the same seven stages: attract, capture, record, qualify, nurture, convert and review. Your chart will differ in detail, but if any of these stages is missing entirely, that is usually where leads are being lost.
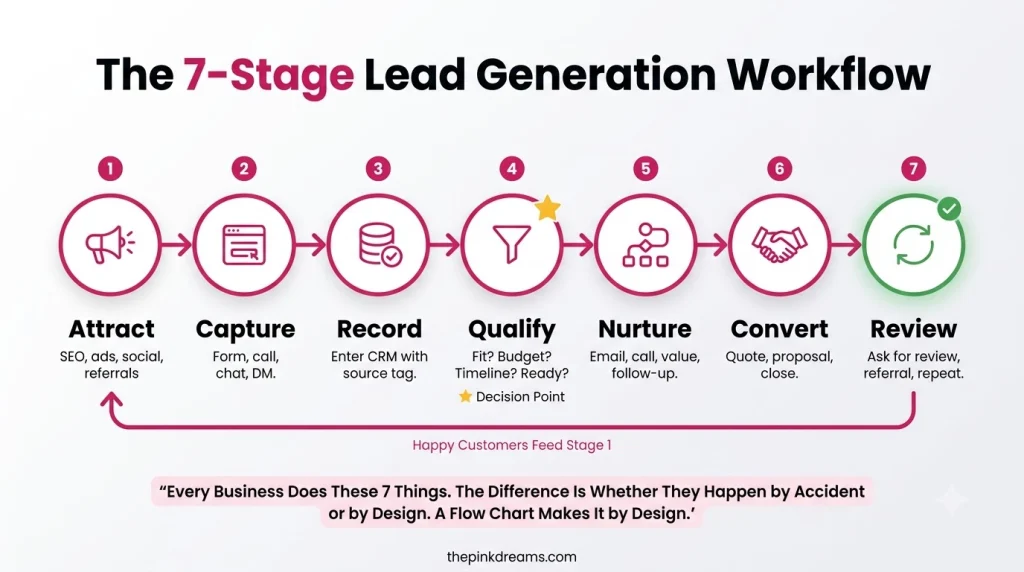
Stage 1: Attract
Everything that brings a potential customer into contact with your business: search results, referrals, social media, advertising, events and outbound outreach. On the chart this is a single entry point, or several arrows feeding into one box, depending on how many channels you run.
Who owns it: Whoever handles marketing, or an external agency.
What moves it to the next box: A prospect arrives on your website, calls, messages or meets you. Our guide to lead sourcing covers where those prospects come from.
Stage 2: Capture
The moment interest becomes contact details. This is the form submission, phone call, message, booking or walk-in. Mark every capture route on the chart, because businesses routinely map the website form and forget that most enquiries actually arrive by phone.
Who owns it: Your website, phone system and messaging channels.
What moves it to the next box: Contact details are successfully received. See how to build a lead generation website for the pages that do this well.
Stage 3: Record
Logging the enquiry somewhere reliable, with its source, date and what was asked. This is the least glamorous box on the chart and the one most often skipped, which is precisely why source tracking is usually unreliable in small businesses.
Who owns it: Whoever receives the enquiry, supported by automation where possible.
What moves it to the next box: The lead exists in your CRM or log with a source and a timestamp.
Stage 4: Qualify
The first real decision point. Does this lead match the work you want, in your area, within a realistic budget and timeframe? A clear qualification rule here saves hours later and prevents your sales effort being spread across people who were never going to buy.
Who owns it: The owner or whoever handles sales conversations.
What moves it to the next box: A yes, no or not-yet answer, each of which sends the lead down a different path.
Stage 5: Nurture
The path for leads who are a good fit but not ready to act. This branch usually contains an email sequence, a diarised check-in and a route back into the main flow when the prospect responds. Without it, “not right now” becomes “never”.
Who owns it: Marketing, or an automated sequence with human check-ins.
What moves it to the next box: The prospect replies, requests a quote or reaches a set follow-up date.
Stage 6: Convert
The steps that turn a qualified lead into a customer: the consultation or site visit, the quote or proposal, follow-up on that quote, and the agreement itself. Show the follow-up loop explicitly, because unanswered quotes are where small businesses lose the most revenue.
Who owns it: Whoever quotes and closes.
What moves it to the next box: The customer accepts, declines or goes quiet, each of which is its own arrow.
Stage 7: Review
The step that closes the loop. Record the outcome against the original source, note why the deal was won or lost, and ask for a review or referral where appropriate. This is what makes the chart improve over time rather than simply describing what already happens.
Who owns it: The owner, usually as part of a monthly review.
What moves it to the next box: Outcome logged and fed back into your reporting. See how to measure lead generation for the numbers that matter.
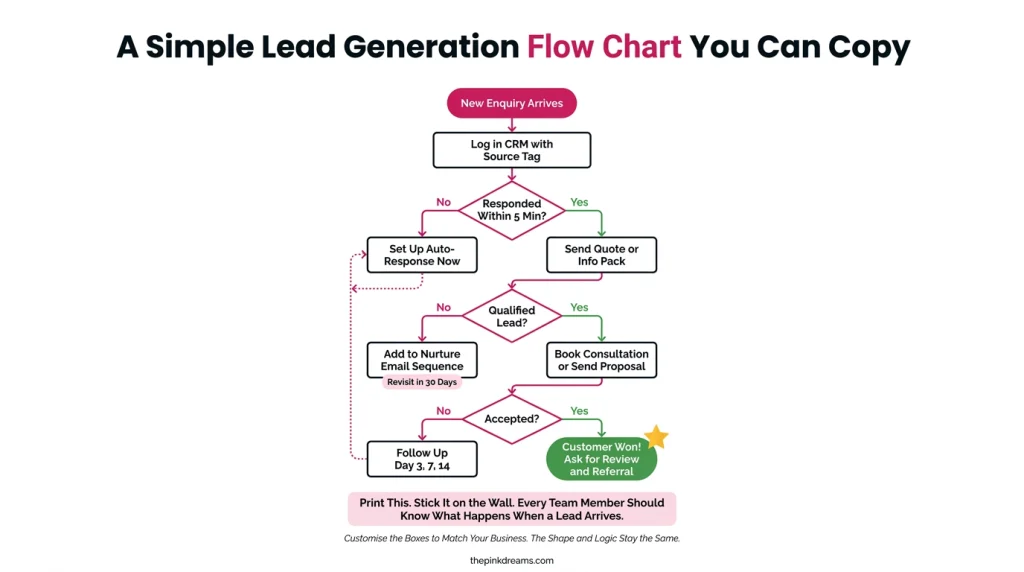
A Simple Lead Generation Flow Chart You Can Copy
Here is a complete small business lead generation flow chart written out in text, so you can copy it straight onto a whiteboard or into a diagram tool. Adapt the wording to your own business, then delete anything that does not reflect what you genuinely do.
( START ) Prospect discovers your business
| search | referral | social | advert
v
[ CAPTURE ] Form, phone call, message or booking
v
[ RECORD ] Log in CRM: name, contact, source, date
v
[ RESPOND ] Acknowledge within 1 hour, reply same day
v
< QUALIFIED? > Right service, area, budget and timing
| |
YES NO
v v
[ CONSULT ] Call, visit or [ DECLINE POLITELY ]
discovery conversation Refer on if you can
v v
[ QUOTE ] Send within 48 hours ( END )
v
< RESPONDED? > Within 5 working days
| |
YES NO
v v
< READY TO BUY? > [ FOLLOW UP ] 3 attempts
| | |
YES NOT YET still no reply
v v v
[ WIN ] [ NURTURE ] Emails + diarised check-in
v | |
[ DELIVER ] +——————-+
v v
[ REVIEW ] Log outcome, back into QUALIFIED? when they reply
source, ask for review
v
( END )
Notice how few boxes there are. A one-page chart that people actually follow beats a detailed diagram that lives in a folder nobody opens.
Key Takeaway: If your chart does not fit on one page, you are mapping tasks rather than the process.
The Decision Points That Make a Flow Chart Useful
Decision points are where a flow chart earns its place, because they turn vague intentions into rules. Most small business charts contain three: is the lead qualified, have they responded, and are they ready to buy. Each needs a written answer before the chart works.
Write each decision as a question with a definite answer. “Is this lead qualified?” is only useful once you have defined qualified: the services you offer, the areas you cover, a realistic budget range and a timeframe you can meet. Without that definition, every person answers the question differently and the chart describes nothing.
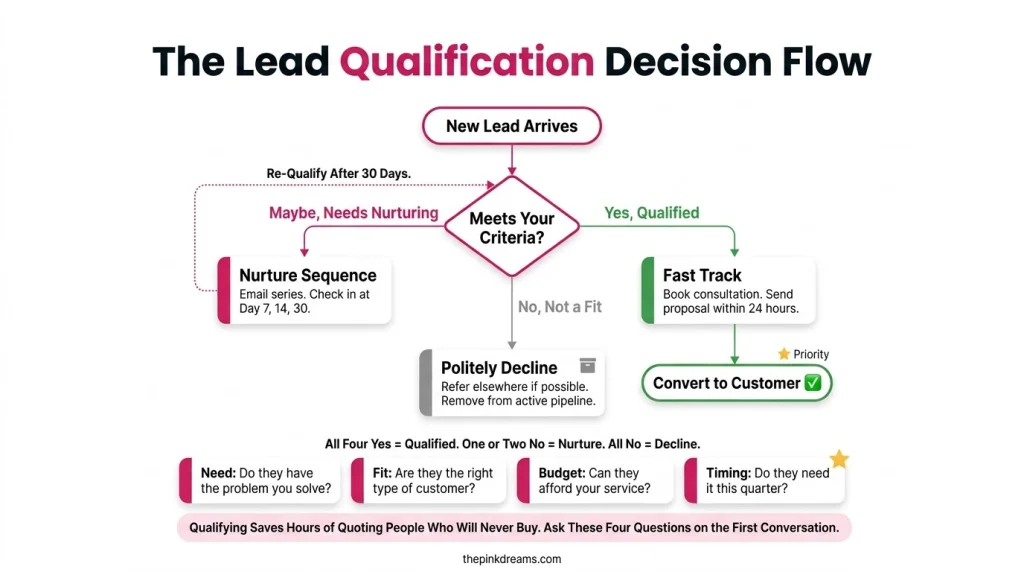
Do the same for time-based decisions. “Have they responded?” needs a deadline attached, such as five working days after the quote. “Are they ready to buy?” needs a signal, such as asking about availability or dates. Then decide what happens on each branch, including the unglamorous ones: how many follow-up attempts before a lead moves to nurture, and how long someone stays on the nurture list before you stop.
Key Takeaway: A decision without a written rule is a guess wearing a diamond shape.
How to Build Your Lead Generation Process Flow Chart in 6 Steps
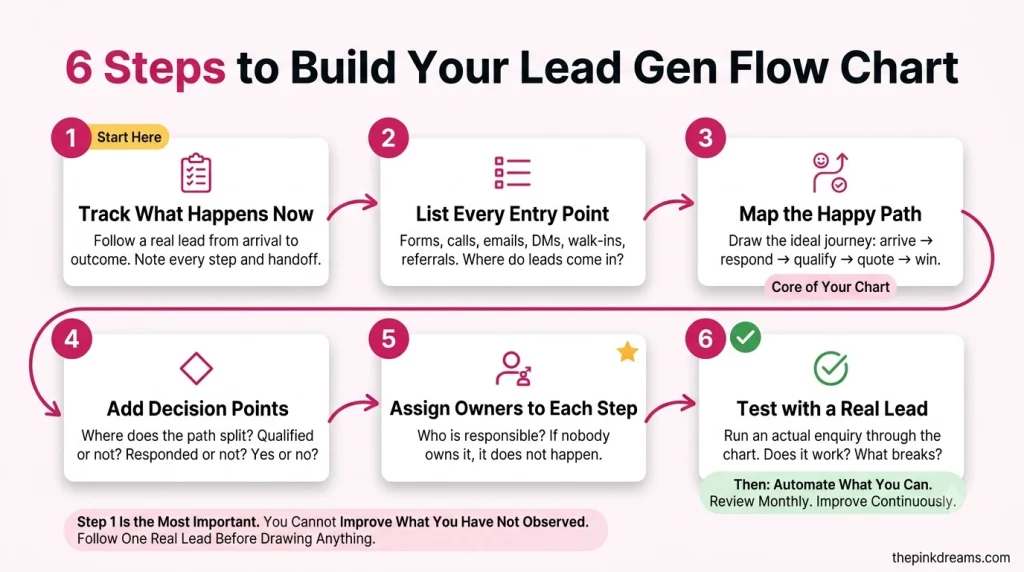
Build your chart by mapping what currently happens, then improving it. Working the other way around produces an idealised diagram nobody follows. Expect the first version to take an hour or two, and expect it to reveal at least one step you thought was happening but is not.
1. Track one real enquiry end to end. Follow a recent lead through your business and write down every step exactly as it happened, including the delays.
2. List every entry point. Phone, website form, email, social messages, walk-ins, referrals. Missing routes are where leads disappear.
3. Draw the happy path first. Map the straight line from enquiry to won customer without branches, so the shape is clear.
4. Add the decision points. Insert your diamonds, write the rule for each one, and draw where every branch leads, including the dead ends.
5. Assign an owner and a time limit to each box. “Respond to enquiry” becomes “owner replies within one hour”. Unowned steps are skipped steps.
6. Test it with the next real lead. Follow the chart exactly. Wherever reality diverges, either fix the process or fix the chart.
Key Takeaway: Map reality first, improve second. A chart of what should happen teaches you nothing.
Which Tools to Use to Draw Your Flow Chart
You do not need specialist software. A whiteboard photograph or a hand-drawn page works perfectly well for a first version, and many small businesses never need anything more. What matters is that the chart is visible to everyone, not that it looks polished.
When you want something tidier, tools such as Lucidchart, Miro, draw.io and Canva all handle flow charts, and most offer free plans with limits that suit a single diagram. Whichever you choose, save the chart somewhere your team will actually see it, print a copy, and put the date on it so everyone knows which version is current.
Key Takeaway: The best tool is whichever one gets the chart on the wall this week.
Common Mistakes When Mapping Your Lead Generation Process
The most common mistakes are mapping the ideal process rather than the real one, leaving decision rules undefined, forgetting entry points such as phone calls, and building a chart so detailed nobody uses it.
• Mapping wishes, not reality: the chart becomes fiction on day one.
• Vague decisions: “qualified” means something different to each person until you define it.
• Missing entry points: the phone and messaging apps are often left off entirely.
• No owners or time limits: steps without a name and a deadline are the ones that slip.
• Too much detail: fifty boxes describing every click will not be followed.
• No dead ends: every “no” branch needs a destination, even if that destination is a polite decline.
• Never revisited: processes drift, so an unreviewed chart is out of date within months.
Several of these overlap with the wider lead generation challenges small businesses face, and mapping the process often makes those problems visible for the first time.
Key Takeaway: An inaccurate chart is worse than none, because people stop trusting it.
How to Use the Flow Chart Once It Is Built
The chart is a working tool, not a document. Use it to train new team members, to find where leads stall, to decide what to automate, and as the reference point whenever you change how enquiries are handled.
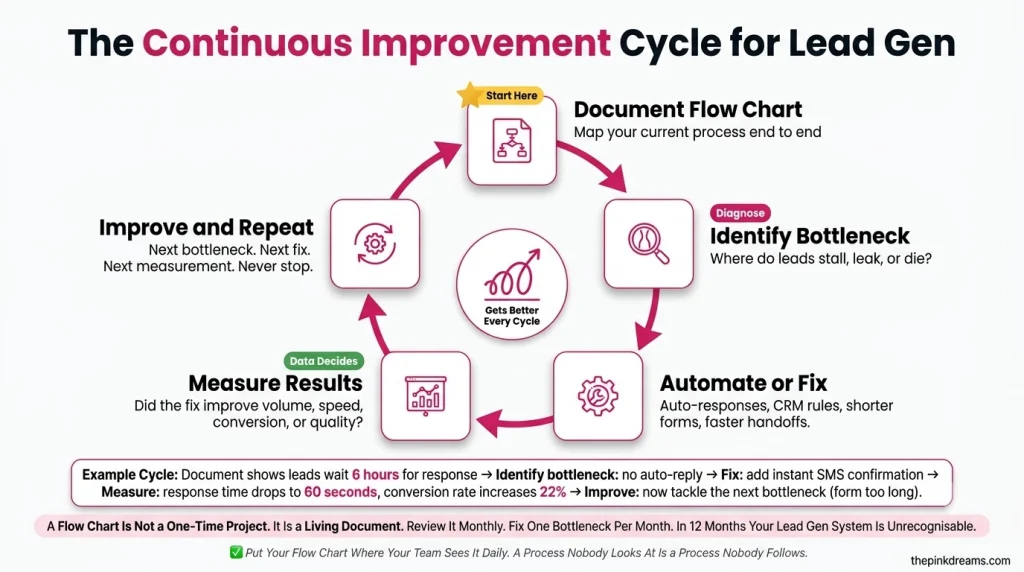
Start by putting it somewhere visible and walking your team through it once. Then, when enquiries go quiet or quotes stop converting, trace a few recent leads through the chart and note the box where they stopped moving. That is your bottleneck, and it is usually a step with no owner or no deadline attached. A lead generation audit follows the same logic in more depth.
Automation becomes obvious once the chart exists. Acknowledgement emails, CRM entry, follow-up reminders and review requests are all boxes a tool can handle, which frees your attention for the conversations that need a person. Review the whole chart quarterly and update the date, because the process will have drifted whether or not anyone noticed.
Key Takeaway: Trace stalled leads through the chart. The box where they stop is the problem to fix.
Turning Your Lead Generation Process Flow Chart Into a Working System
A lead generation process flow chart is worth building because it converts an invisible routine into something you can examine, teach and improve. Most small businesses discover two things during the exercise: a step they assumed was happening is not, and a decision everyone thought was agreed has never actually been defined.
Keep the first version rough. An hour with a whiteboard, one real enquiry traced honestly from start to finish, and a photograph on the wall will do more for your pipeline than a polished diagram produced over a fortnight. Precision can come later, once the chart has survived contact with a few genuine leads.
What turns the chart into a system is the habit around it: owners named on every box, time limits that people keep, and a quarterly look to see where reality has drifted. Businesses that do that stop losing enquiries to forgetfulness, which is a quieter and more expensive problem than any marketing challenge.
If you would rather have specialists map, fix and run this process with you, Pinkdreams can help. Pinkdreams is a digital marketing agency that helps businesses attract more customers through search, paid media, content and conversion-focused strategy. Our team reviews your current visibility and pipeline, builds a customised roadmap, and handles the work needed to turn enquiries into clients. Request a free digital presence audit to see where you stand.
FAQ
What is a lead generation process flow chart?
A lead generation process flow chart is a diagram showing every step and decision between a prospect first discovering your business and becoming a customer. Boxes show actions, diamonds show decisions such as whether a lead is qualified, and arrows show the path leads take, including follow-up loops and dead ends.
What are the stages of a lead generation process?
Most small business processes contain seven stages: attract, capture, record, qualify, nurture, convert and review. Attract brings prospects in, capture collects their details, records logs them, qualifies, decides whether to pursue them, nurture handles those not ready yet, convert closes the sale and review records the outcome.
How do I create a lead generation flow chart?
Trace one real enquiry from first contact to outcome, list every entry point including phone and messages, draw the straight path from enquiry to customer, add decision points with written rules, assign an owner and time limit to each step, then test the chart against your next real lead.
What tools can I use to make a flow chart?
A whiteboard or a sheet of paper is enough for a first version. For a tidier chart, tools such as Lucidchart, Miro, draw.io and Canva all support flowcharts and most offer free plans. What matters far more than the tool is that the chart is visible and kept up to date.
How often should I update my lead generation process?
Review the chart quarterly, and immediately after any change to your team, tools or services. Processes drift quietly, so a chart that was accurate six months ago may no longer describe what happens. Put a date on every version so everyone knows which one is current.

Digital Marketing Strategist & Business Coach
As a leading digital marketing strategist and business coach, he is responsible for helping entrepreneurs and brands grow faster in a smarter, more scalable way. With over 20 years of experience, Nagarajan specializes in practical coaching, automation-first marketing strategies, and technology-driven growth systems. His work focuses on enhancing brand visibility, improving performance, and building sustainable frameworks that enable long-term business success.