




The numbers small business owners actually need, how to calculate them, and how to tell which marketing earned the sale.
Your marketing report says traffic is up 40 percent. Your bank balance disagrees.
That gap is what proper measurement closes. Knowing how to measure lead generation means tracking a short list of numbers that connect marketing activity to enquiries, and enquiries to revenue. Most small businesses track far too many metrics and still cannot answer the one question that matters: which marketing is bringing in paying customers? If you suspect something is broken rather than unmeasured, start with a lead generation audit instead.
This guide covers the five numbers to start with, the full set of lead generation KPIs grouped by what they tell you, the formulas to calculate each one, how lead attribution works in plain English, why attribution got harder in 2026, and how to build a one-page dashboard you will actually use.
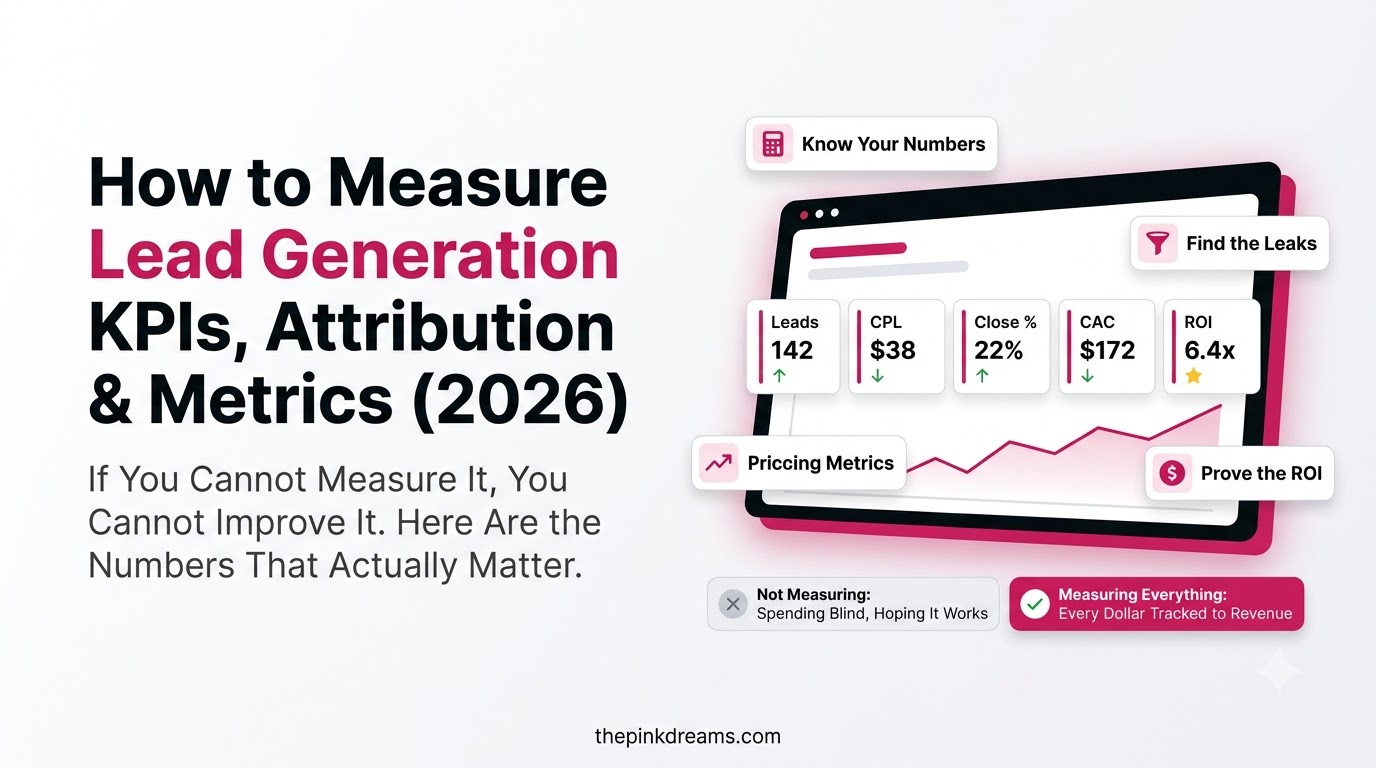
The short answer: measure lead generation by tracking leads, cost per lead, lead-to-customer rate, customer acquisition cost and return on investment, broken down by channel. Everything else is detail you add once those five are reliable.
Key Takeaways
- Measure lead generation by connecting four things: how many leads, at what cost, of what quality, and how much revenue they produce.
- Five KPIs cover most small businesses: leads, cost per lead, lead-to-customer rate, customer acquisition cost and return on investment.
- Cost per lead alone is misleading. A cheap lead that never buys costs more than an expensive one that does.
- Track every KPI by channel. Averages hide both your best and worst performing marketing.
- Attribution decides which marketing gets credit for a sale, and no model is perfect.
- Small businesses rarely need complex attribution software. A “how did you hear about us” question plus CRM source tracking covers most of it.
- Privacy rules, cookie limits and AI search results make tracking less complete than it once was, so expect gaps.
- Compare your numbers with your own history, not with published industry benchmarks.
What Does It Mean to Measure Lead Generation?
Measuring lead generation means tracking how marketing activity turns into enquiries, and how those enquiries turn into customers and revenue. It combines four dimensions: volume (how many), cost (how much each one costs), quality (how many become customers) and speed (how quickly they move).
Most reporting fails because it stops at the first dimension. Traffic and lead counts are easy to collect and easy to feel good about, but they say nothing about whether the marketing paid for itself.
• Volume: are we generating enough interest? Measured by leads per month.
• Cost: what are we paying for each one? Measured by cost per lead.
• Quality: are these the right people? Measured by lead-to-customer rate.
• Speed: how fast do they move, and how fast do we respond? Measured by response time.
• Value: is any of this making money? Measured by return on investment.
Key Takeaway: Volume without cost, quality and value is a vanity number.
The 5 Lead Generation KPIs Every Small Business Should Track First
If you track nothing else, track these five: number of leads, cost per lead, lead-to-customer rate, customer acquisition cost and return on investment. Together they answer whether your marketing produces enough of the right enquiries at a price your business can afford.
| KPI | Formula | Why it matters |
| Leads per month | Count of new enquiries | Shows whether demand is growing or shrinking |
| Cost per lead (CPL) | Total spend divided by number of leads | Shows what each enquiry costs to generate |
| Lead-to-customer rate | Customers divided by leads, times 100 | Shows lead quality and follow-up effectiveness |
| Customer acquisition cost (CAC) | Total sales and marketing cost divided by new customers | Shows what winning a customer really costs |
| Return on investment (ROI) | Revenue minus cost, divided by cost, times 100 | Shows whether the whole effort pays off |
Track all five monthly, and track them separately for each channel. One strong channel and one weak one often average out to an unremarkable middle, which tells you nothing useful.
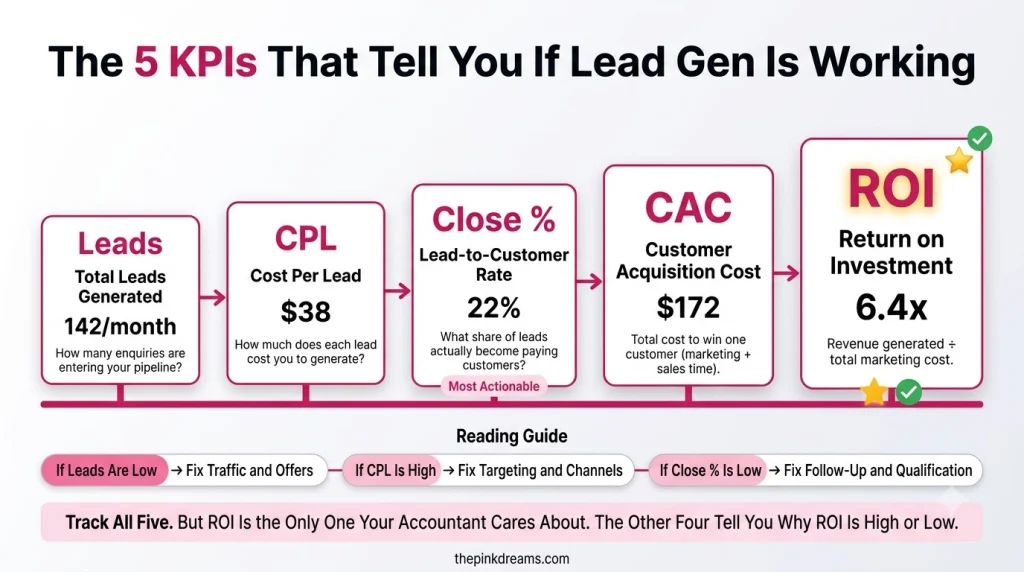
Key Takeaway: Five numbers, reviewed monthly, beat twenty numbers reviewed never.
Lead Generation Metrics by Category: Volume, Cost, Quality, Speed
Beyond the core five, lead generation metrics fall into four groups. Volume metrics show how much interest you generate, cost metrics show efficiency, quality metrics show whether leads become customers, and speed metrics show how quickly your funnel moves. Add metrics from each group only when you will act on them.
Volume Metrics: How Much Interest Are You Generating?
Volume metrics count the people entering your funnel at each stage. They are the easiest to collect and the easiest to misread, so always pair them with a quality or cost metric.
| KPI | How to calculate it | What it tells you |
| Website visitors | Count of unique visitors | Size of your top-of-funnel audience |
| Traffic-to-lead rate | Leads divided by visitors, times 100 | How well your website converts attention |
| Marketing qualified leads (MQLs) | Count of leads meeting your marketing criteria | How many leads are worth sales attention |
| Sales qualified leads (SQLs) | Count of leads sales accepts as genuine | Whether marketing and sales agree on quality |
| Leads by channel | Count of leads per source | Which marketing is actually producing enquiries |
For very small teams, MQL and SQL can simply mean “worth following up” and “worth quoting”. The labels matter far less than everyone agreeing what they mean.
Key Takeaway: Volume tells you the size of the opportunity, never the value of it.
Cost and Efficiency Metrics: What Are Your Leads Costing You?
Cost metrics show whether your lead generation is affordable. Calculate them per channel, and include your own time where it is significant, not just the money you spend on advertising.
| KPI | How to calculate it | What it tells you |
| Cost per lead (CPL) | Channel spend divided by leads from that channel | Efficiency of each marketing channel |
| Cost per qualified lead | Channel spend divided by qualified leads | A truer picture than raw cost per lead |
| Customer acquisition cost (CAC) | Sales and marketing cost divided by new customers | What each new customer really costs |
| Return on ad spend (ROAS) | Revenue from ads divided by ad spend | Whether paid campaigns are profitable |
| Marketing ROI | Revenue minus cost, divided by cost, times 100 | Overall payback from marketing |
Advertising costs vary widely by country, industry and season, so there is no universal target figure. Judge your cost per lead against your own margins and your own previous months. If paid search is a major channel, PPC and paid search management is usually where cost per lead is won or lost.
Key Takeaway: A rising cost per lead is only a problem if quality is not rising with it.
Quality Metrics: Are You Attracting the Right Leads?
Quality metrics answer the question that cost metrics cannot: do these leads actually buy? A campaign with a low cost per lead and a poor conversion rate is usually the most expensive marketing in the business.
| KPI | How to calculate it | What it tells you |
| Lead-to-customer rate | Customers divided by leads, times 100 | Overall lead quality and follow-up strength |
| MQL to SQL rate | SQLs divided by MQLs, times 100 | Whether marketing is passing on the right leads |
| Close rate | Deals won divided by quotes or proposals sent | How well you convert serious opportunities |
| Average deal value | Total revenue divided by number of customers | Whether campaigns attract bigger or smaller jobs |
| Customer lifetime value (CLV) | Average purchase value times purchase frequency times customer lifespan | What a customer is worth over time |
| Churn or repeat rate | Customers lost or retained over a period | Whether new customers stay |
Comparing customer lifetime value with customer acquisition cost is the single most useful ratio in small business marketing. If a customer is worth far more over time than they cost to acquire, you can invest more confidently in growth.
Key Takeaway: Customer lifetime value sets the ceiling on what you can afford to pay for a lead.
Speed Metrics: How Quickly Does Your Funnel Move?
Speed metrics reveal problems that volume and cost figures hide. Slow first responses and long sales cycles quietly reduce conversion, and response time is usually the fastest of all these numbers to improve.
| KPI | How to calculate it | What it tells you |
| Average response time | Total time to first reply divided by number of enquiries | How quickly you reach new leads |
| Time to conversion | Total days from lead to sale divided by conversions | How long your sales cycle really takes |
| Follow-up attempts per lead | Total touches divided by number of leads | Whether follow-up is consistent |
| Sales velocity | Opportunities times average deal value times win rate, divided by sales cycle length | How much revenue your pipeline produces over time |
| Lead response coverage | Share of leads contacted within your target time | Whether your response rule is actually followed |
Key Takeaway: Response time is usually the cheapest metric to improve and the fastest to show results.
Channel Metrics: Which Marketing Is Actually Working?
Channel metrics are not separate numbers. They are the metrics above, calculated per source. Split leads, cost per lead, conversion rate and revenue by channel, and the picture changes immediately, because a strong channel and a failing one otherwise blend into a single unhelpful average.
Two of these deserve particular attention. Revenue by channel is the number that should drive budget decisions, rather than leads by channel, because volume and income rarely rank the same way. Assisted conversions show which channels appear earlier in the journey without ever being the final click.
Content-led channels often look weak on last-click reporting while quietly influencing many sales. Our guide to content marketing lead generation explains how those assists usually appear in the data.
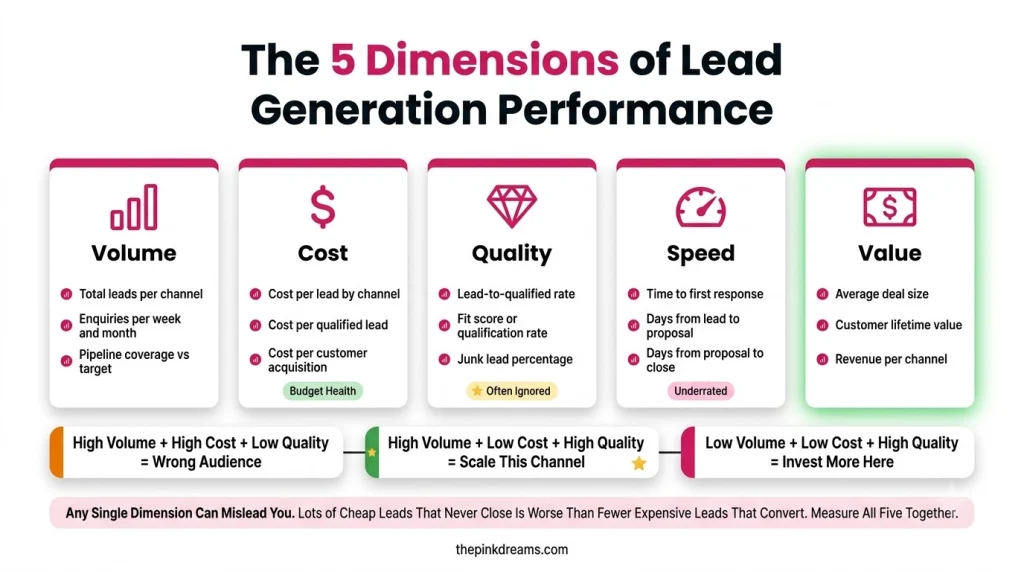
Key Takeaway: Move budget on revenue by channel, not on leads by channel.
Lead Attribution Explained: Which Marketing Gets the Credit?
Lead attribution is how you decide which marketing touchpoint gets credit for a sale. Most customers interact with your business several times before buying, so the choice of attribution model changes which channel looks successful. No model is perfectly accurate, and every model is a simplification.
| Attribution model | How credit is assigned | Best for |
| First touch | All credit to the first interaction | Understanding what creates awareness |
| Last touch | All credit to the final interaction before enquiry | Simple reporting, short sales cycles |
| Linear | Credit split evenly across all touchpoints | Seeing the full journey at a glance |
| Time decay | More credit to touchpoints closer to the sale | Longer sales cycles with active nurturing |
| Position based | Most credit to first and last, the rest shared | Balancing awareness and closing |
| Data driven | Credit assigned by modelled contribution | Businesses with high volumes of data |
A practical example. A prospect reads your blog post after a Google search, comes back through a Facebook post a week later, then searches your business name and calls. Last-touch attribution credits the branded search. First-touch credits the blog post. Neither is wrong, and neither is complete.
For most small businesses, the practical answer is simple: use last touch for day-to-day reporting because it is easy and consistent, but ask every new enquiry how they heard about you. That one question captures the offline conversations, referrals and word of mouth that no analytics tool ever sees.
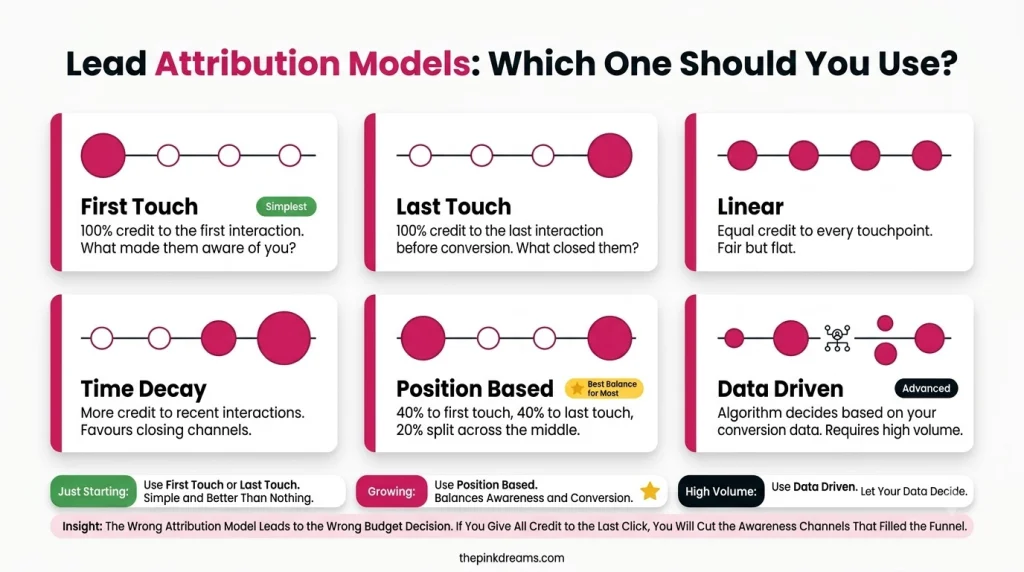
Key Takeaway: Attribution is a lens, not the truth. Pick one, apply it consistently, and back it up by asking people directly.
Why Attribution Is Harder in 2026, and What to Do About It
Attribution has become less complete because of privacy regulation, browser restrictions on third-party cookies, consent banners, and the growth of AI search answers and private social sharing. The result is that some of your real marketing influence will never appear in your analytics, and you should plan reporting around that.
• Privacy rules and consent banners hide visitors who decline tracking, so compare trends rather than absolute totals.
• Third-party cookie restrictions make journeys across sites harder to follow, so lean on the first-party data in your own CRM.
• AI search answers let people get what they need without visiting your website, so watch branded searches and direct enquiries.
• Private sharing in messages and groups makes referrals look like direct traffic, which is why asking how people heard about you matters.
• Multiple devices per person make one buyer look like several visitors, so use logged-in or CRM data wherever you can.
The practical takeaway is not to abandon measurement, but to expect gaps and to treat your CRM as the source of truth. Your own records of who enquired, what they said and whether they bought are the one dataset no platform change can take away.
Key Takeaway: Your CRM is now more reliable than your analytics. Keep it clean.
How to Build a Simple Lead Generation Dashboard
A useful small business dashboard fits on one page and answers three questions: are we generating enough leads, are they good enough, and are we making money? Review a small set of numbers weekly, a fuller set monthly, and the strategic picture quarterly.
| Frequency | What to review | Why |
| Weekly | New leads, leads by source, response time | Catch problems while you can still fix the month |
| Monthly | Cost per lead, lead-to-customer rate, revenue by channel | Decide where next month’s effort and budget go |
| Quarterly | Customer acquisition cost, lifetime value, ROI, channel mix | Make bigger decisions about strategy and spend |
Keep it in whatever tool you already use. A spreadsheet updated monthly and actually read is worth more than an automated dashboard nobody opens. Add a short note each month explaining anything unusual, because context is what you will have forgotten by the time you review the year.
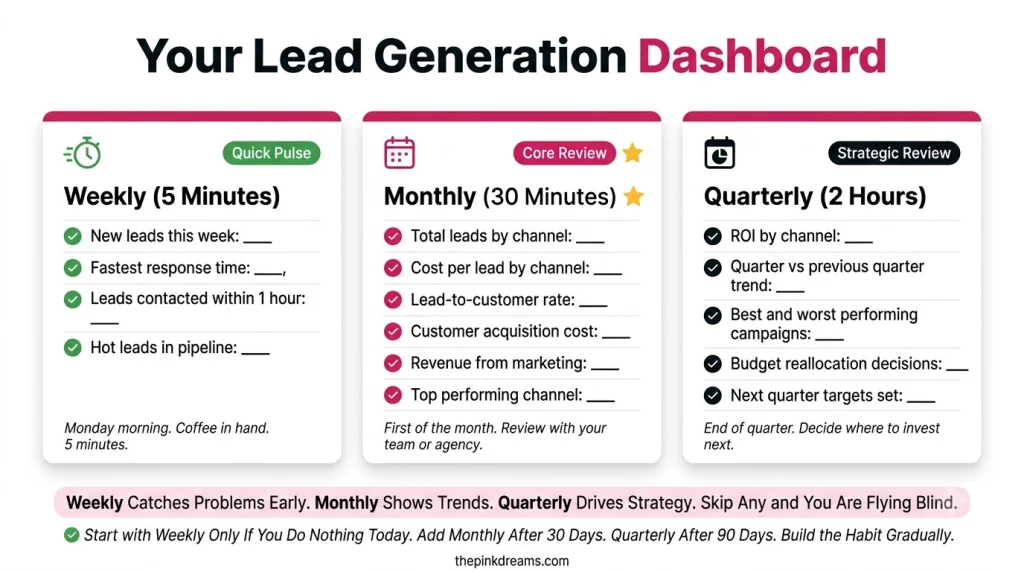
Key Takeaway: One page, three questions, reviewed on a schedule you keep.
Common Lead Generation Measurement Mistakes to Avoid
The most common measurement mistakes are tracking volume without value, judging channels on cost per lead alone, comparing yourself with industry benchmarks, changing several things at once, and reporting on averages that hide the detail. Each one leads to confident decisions based on misleading numbers.
• Celebrating traffic and lead counts without checking how many became customers.
• Judging channels on cost per lead alone, ignoring which leads actually buy.
• Comparing with published benchmarks from other industries, countries or business sizes.
• Changing several things at once, so no result can be explained.
• Reporting only averages, which hide your best and worst performing channels.
• Ignoring offline and word-of-mouth sources, which analytics tools cannot see.
• Measuring too short a period, especially for content and search, which build slowly.
If your numbers are consistently confusing rather than simply disappointing, the problem is usually tracking setup rather than marketing performance. Lead generation consulting can help untangle that before you spend more.
Key Takeaway: Bad measurement is worse than no measurement, because it feels like evidence.
How to Measure Lead Generation Without Drowning in Data
Knowing how to measure lead generation comes down to discipline rather than software. Start with five numbers, calculate them the same way every month, break them down by channel, and accept that attribution will always be an estimate rather than a fact. That combination tells you more than any dashboard full of metrics nobody understands.
If you are starting from nothing, the first month is mostly plumbing. Record every enquiry and its source in one place, add a “how did you hear about us” field to your forms, and note the date each enquiry became a customer. Within 90 days you will have enough history to see patterns, and within two quarters you will be able to move the budget with real confidence.
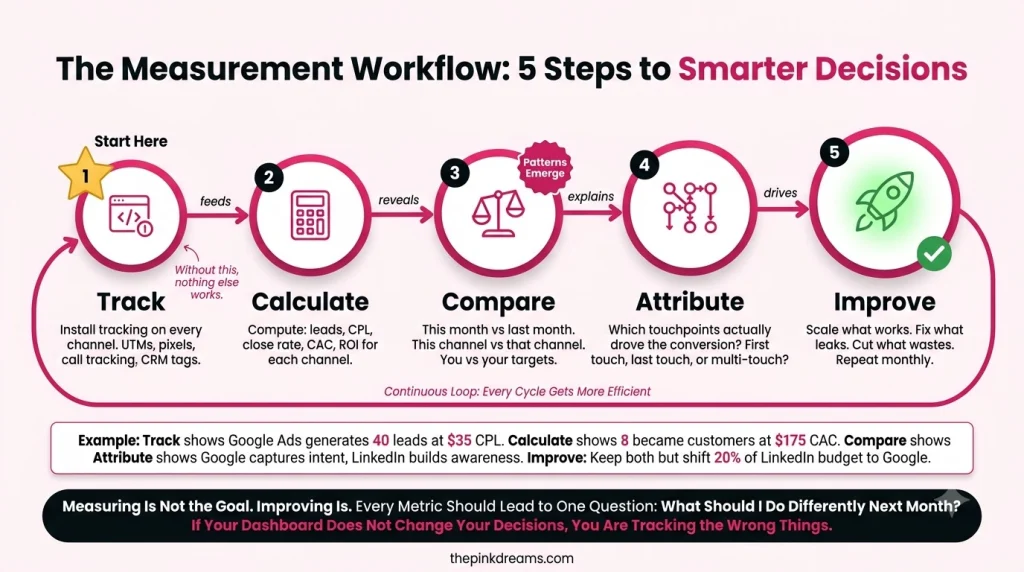
The businesses that grow steadily are rarely the ones with the most sophisticated reporting. They are the ones that check a small set of numbers every month, ask what changed, and act on the answer. Our guide on how to generate leads for small businesses covers the activities those numbers are measuring, and lead generation campaign examples show what good performance looks like in practice.
If you would rather have your measurement set up properly and reviewed by specialists, Pinkdreams can help. Pinkdreams is a digital marketing agency that helps businesses attract more customers through search, paid media, content and conversion-focused strategy. Our team reviews your current visibility and pipeline, builds a customised roadmap, and handles the work needed to turn enquiries into clients. Request a free digital presence audit to see where you stand.
FAQ
How do you measure lead generation success?
Measure lead generation success by tracking five KPIs: number of leads, cost per lead, lead-to-customer rate, customer acquisition cost and return on investment. Break each one down by channel and review monthly. Success means generating enough qualified enquiries at a cost your margins can support, not simply increasing traffic or lead volume.
What is a good cost per lead?
There is no universal figure, because cost per lead varies widely by industry, country, channel and competition. A cost per lead is good when the resulting customers are worth comfortably more than they cost to win. Compare your cost per lead with your own previous months and with your customer lifetime value.
What is the difference between a KPI and a metric?
A metric is any number you can measure, such as website visitors or email opens. A KPI is a metric you have chosen because it indicates whether the business is achieving a goal, such as cost per lead or lead-to-customer rate. Every KPI is a metric, but most metrics are not KPIs.
What is lead attribution and which model should I use?
Lead attribution decides which marketing touchpoint receives credit for a sale. Common models include first touch, last touch, linear, time decay and position based. Most small businesses should use last-touch reporting for simplicity, and ask every enquirer how they heard about you to capture offline and word-of-mouth sources.
How often should I review my lead generation metrics?
Review new leads, sources and response times weekly, cost per lead and conversion rates monthly, and customer acquisition cost, lifetime value and return on investment quarterly. Weekly reviews catch problems early, monthly reviews guide budget decisions, and quarterly reviews inform bigger strategic choices about channels and investment.

Digital Marketing Strategist & Business Coach
As a leading digital marketing strategist and business coach, he is responsible for helping entrepreneurs and brands grow faster in a smarter, more scalable way. With over 20 years of experience, Nagarajan specializes in practical coaching, automation-first marketing strategies, and technology-driven growth systems. His work focuses on enhancing brand visibility, improving performance, and building sustainable frameworks that enable long-term business success.